What Really Happens at Events. Real Insights from Practice.
Trade shows and event formats are complex systems. Yet many decisions are still made based on assumptions rather than measurable insights. Our use cases show how this changes once behavior becomes measurable. Using real-world projects, it becomes clear: Which patterns can be identified in visitor flows. How content and event space are actually used. What insights can be derived for operations, marketing, and sales. These cases are continuously expanded: forming a growing collection of practical applications and insights from real-world implementations.
Rittal / Hannover Messe 2026: Making Trade Show Performance Systematically Measurable
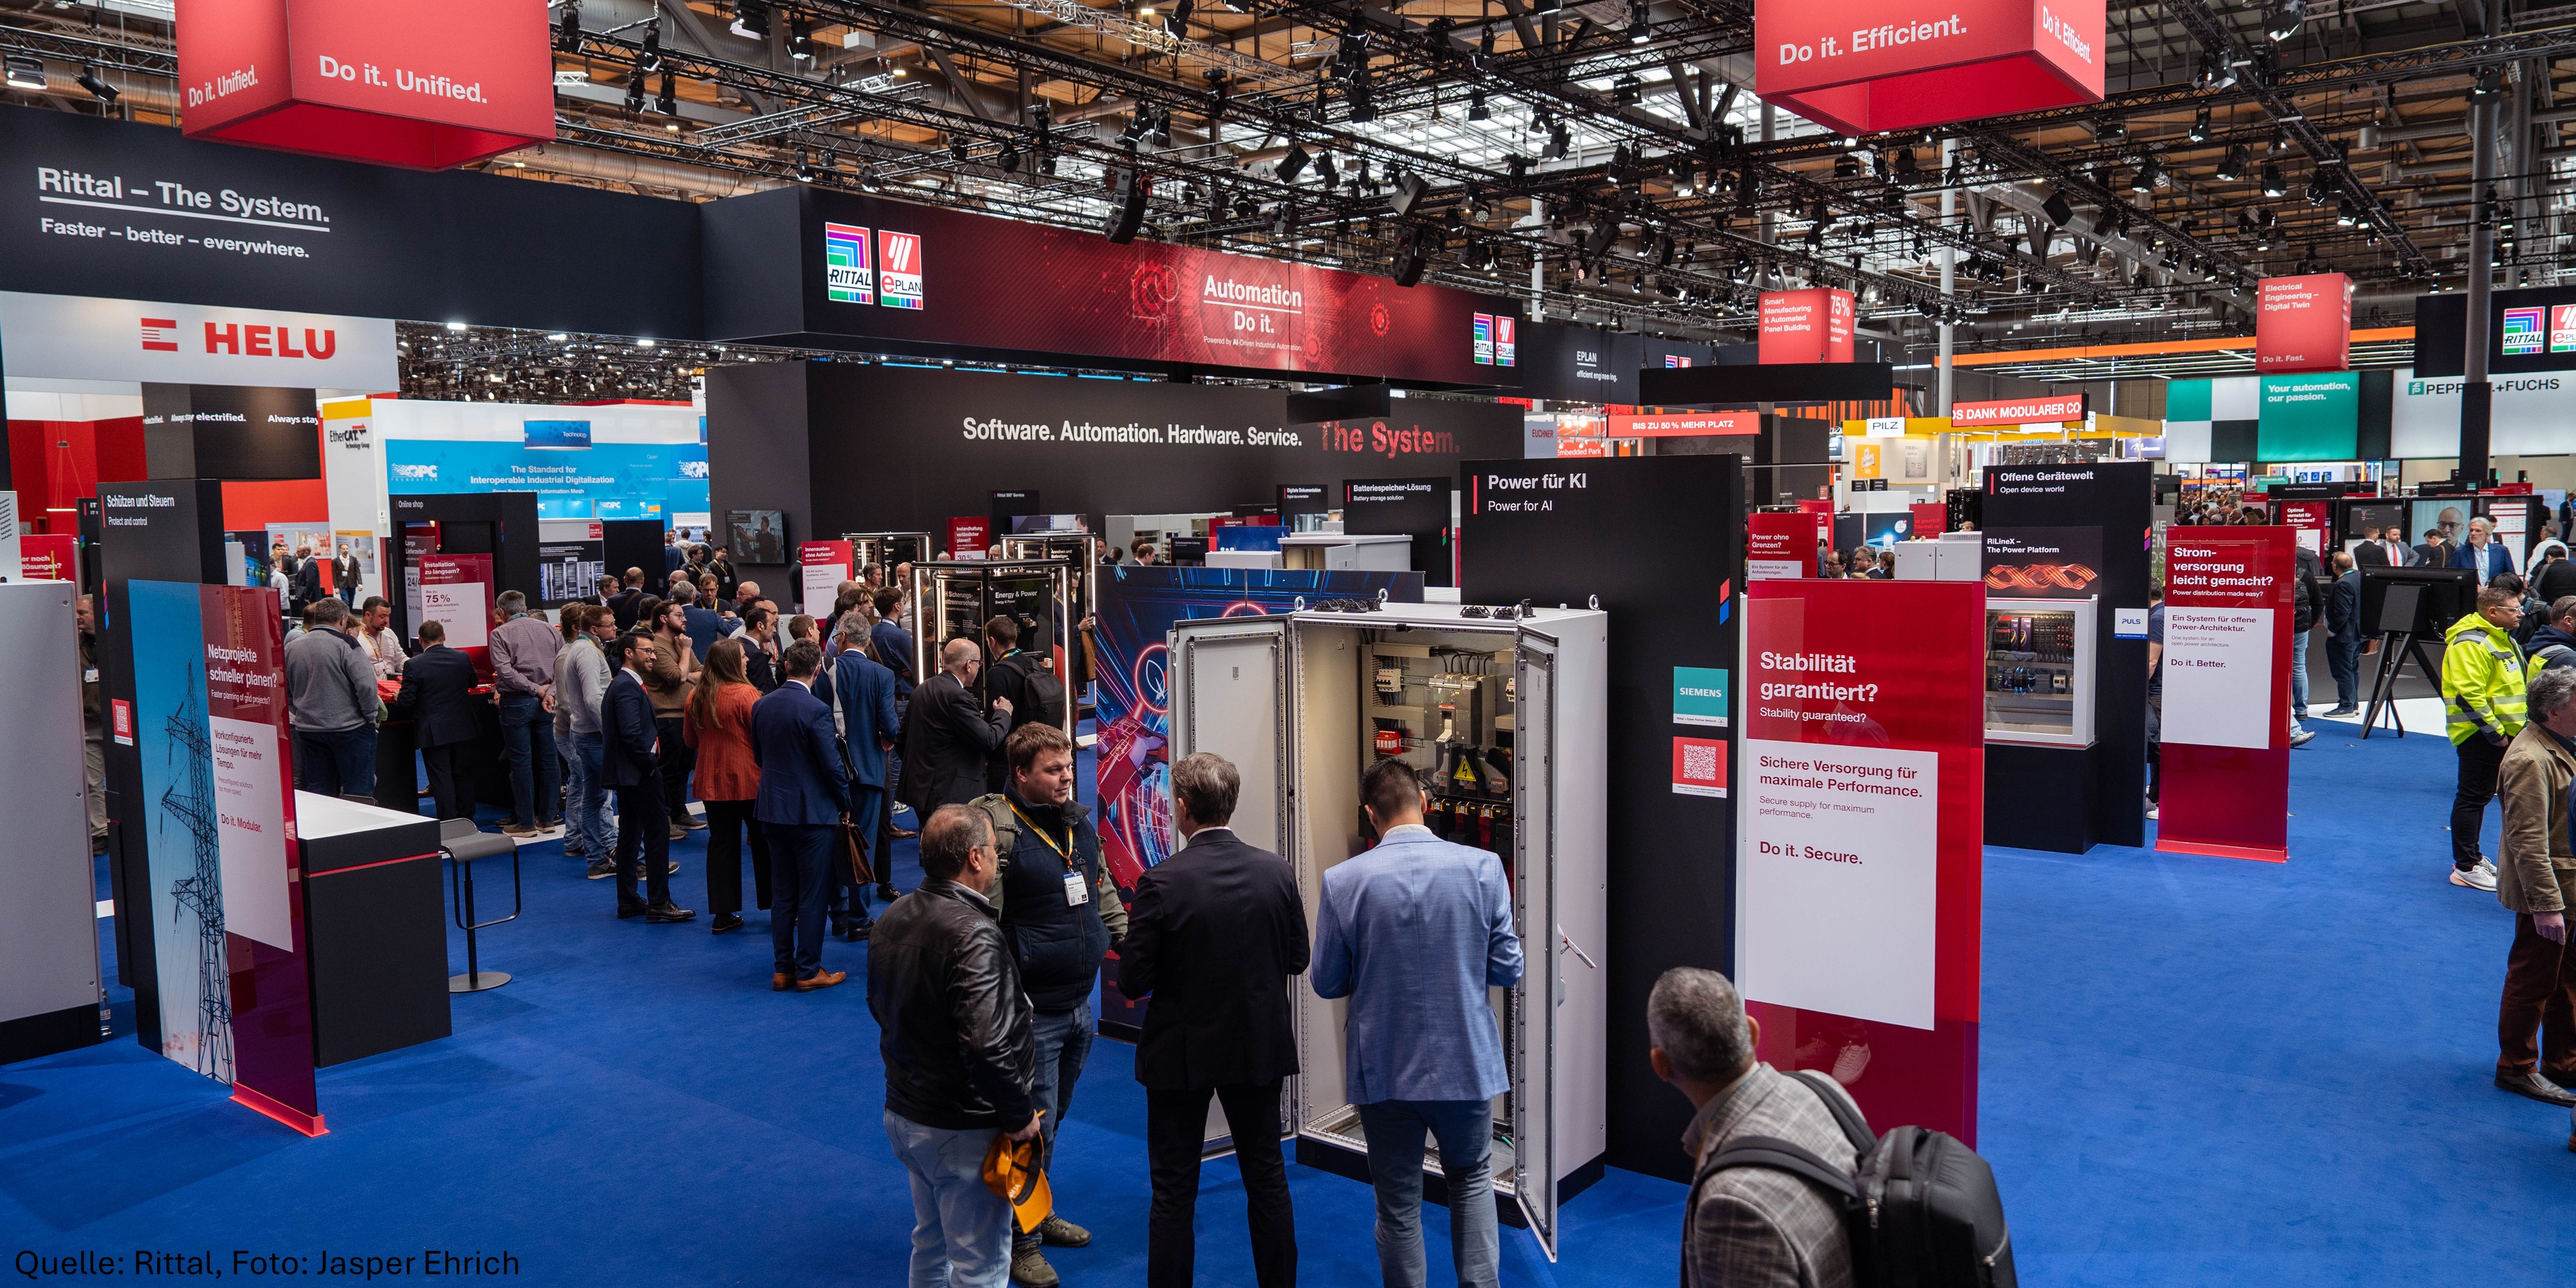
How does a trade show booth become a fully measurable system? | How is Rittal creating the foundation for data-driven decision-making at Hannover Messe?
Initial Situation
Trade show appearances represent one of the largest investments in marketing and sales for many industrial companies. At the same time, the question of their actual impact often remains unanswered.
Rittal faced a key challenge ahead of Hannover Messe 2026:
▪️ How can the success of a trade show booth be objectively evaluated, beyond visitor numbers, leads, or subjective impressions?
▪️ Which areas truly attract visitors?
▪️ Where do meaningful interactions with content take place and where do people simply pass through?
▪️ And how can these insights be translated into better decisions for future trade show formats?
To address these questions, the booth was approached together with knw. as a measurable system.
Technical Implementation
At the core of the project was the full structuring and analysis of the booth into clearly defined areas and zones.
The entire booth was divided into functional segments, from product areas such as Electrical Engineering, Automation, and Cooling to catering and communication zones. Within these areas, additional sub-zones were defined to enable more granular insights at the exhibit level.
For each of these zones, precise data was collected:
▪️ Visitor frequency and movement patterns
▪️ Dwell time as an indicator of engagement
▪️ Temporal occupancy and peak loads
▪️ Entry and exit data based on defined tracking lines
A strong emphasis was placed on data quality and methodology:
Only dwell times between 5 and 60 minutes were considered to capture meaningful interactions and exclude distortion from short-pass visitors or booth staff.
All data was compiled in a structured reporting framework, enabling - for the first time - a comprehensive analysis of the booth across all exhibition days, including temporal trends, space utilization, and visitor behavior.
Value Delivered for Rittal
Through this analysis, the booth evolved from a traditional presentation space into a fully measurable system.
Rittal was able to clearly understand how visitors actually move through the booth and which content areas generate real engagement.
Key findings included:
▪️ Over 33,000 qualified visits with measurable dwell time
▪️ An average dwell time of more than 12 minutes
▪️ Significant differences between individual topic areas
▪️ Distinct peak times and usage patterns
These insights enable a new level of decision-making:
▪️ Targeted optimization of booth concepts and exhibit placement
▪️ Data-driven allocation of staff and resources
▪️ Improved evaluation of return on investment for individual measures
At the same time, the systematic data collection establishes the foundation for a broader shift in perspective:
Trade show performance becomes comparable, not only within a single booth, but across multiple events over time.
Another important aspect is the sharing of insights within the industry. Rittal actively promotes exchange with other exhibitors to foster mutual learning and establish new standards for data-driven trade show evaluation.
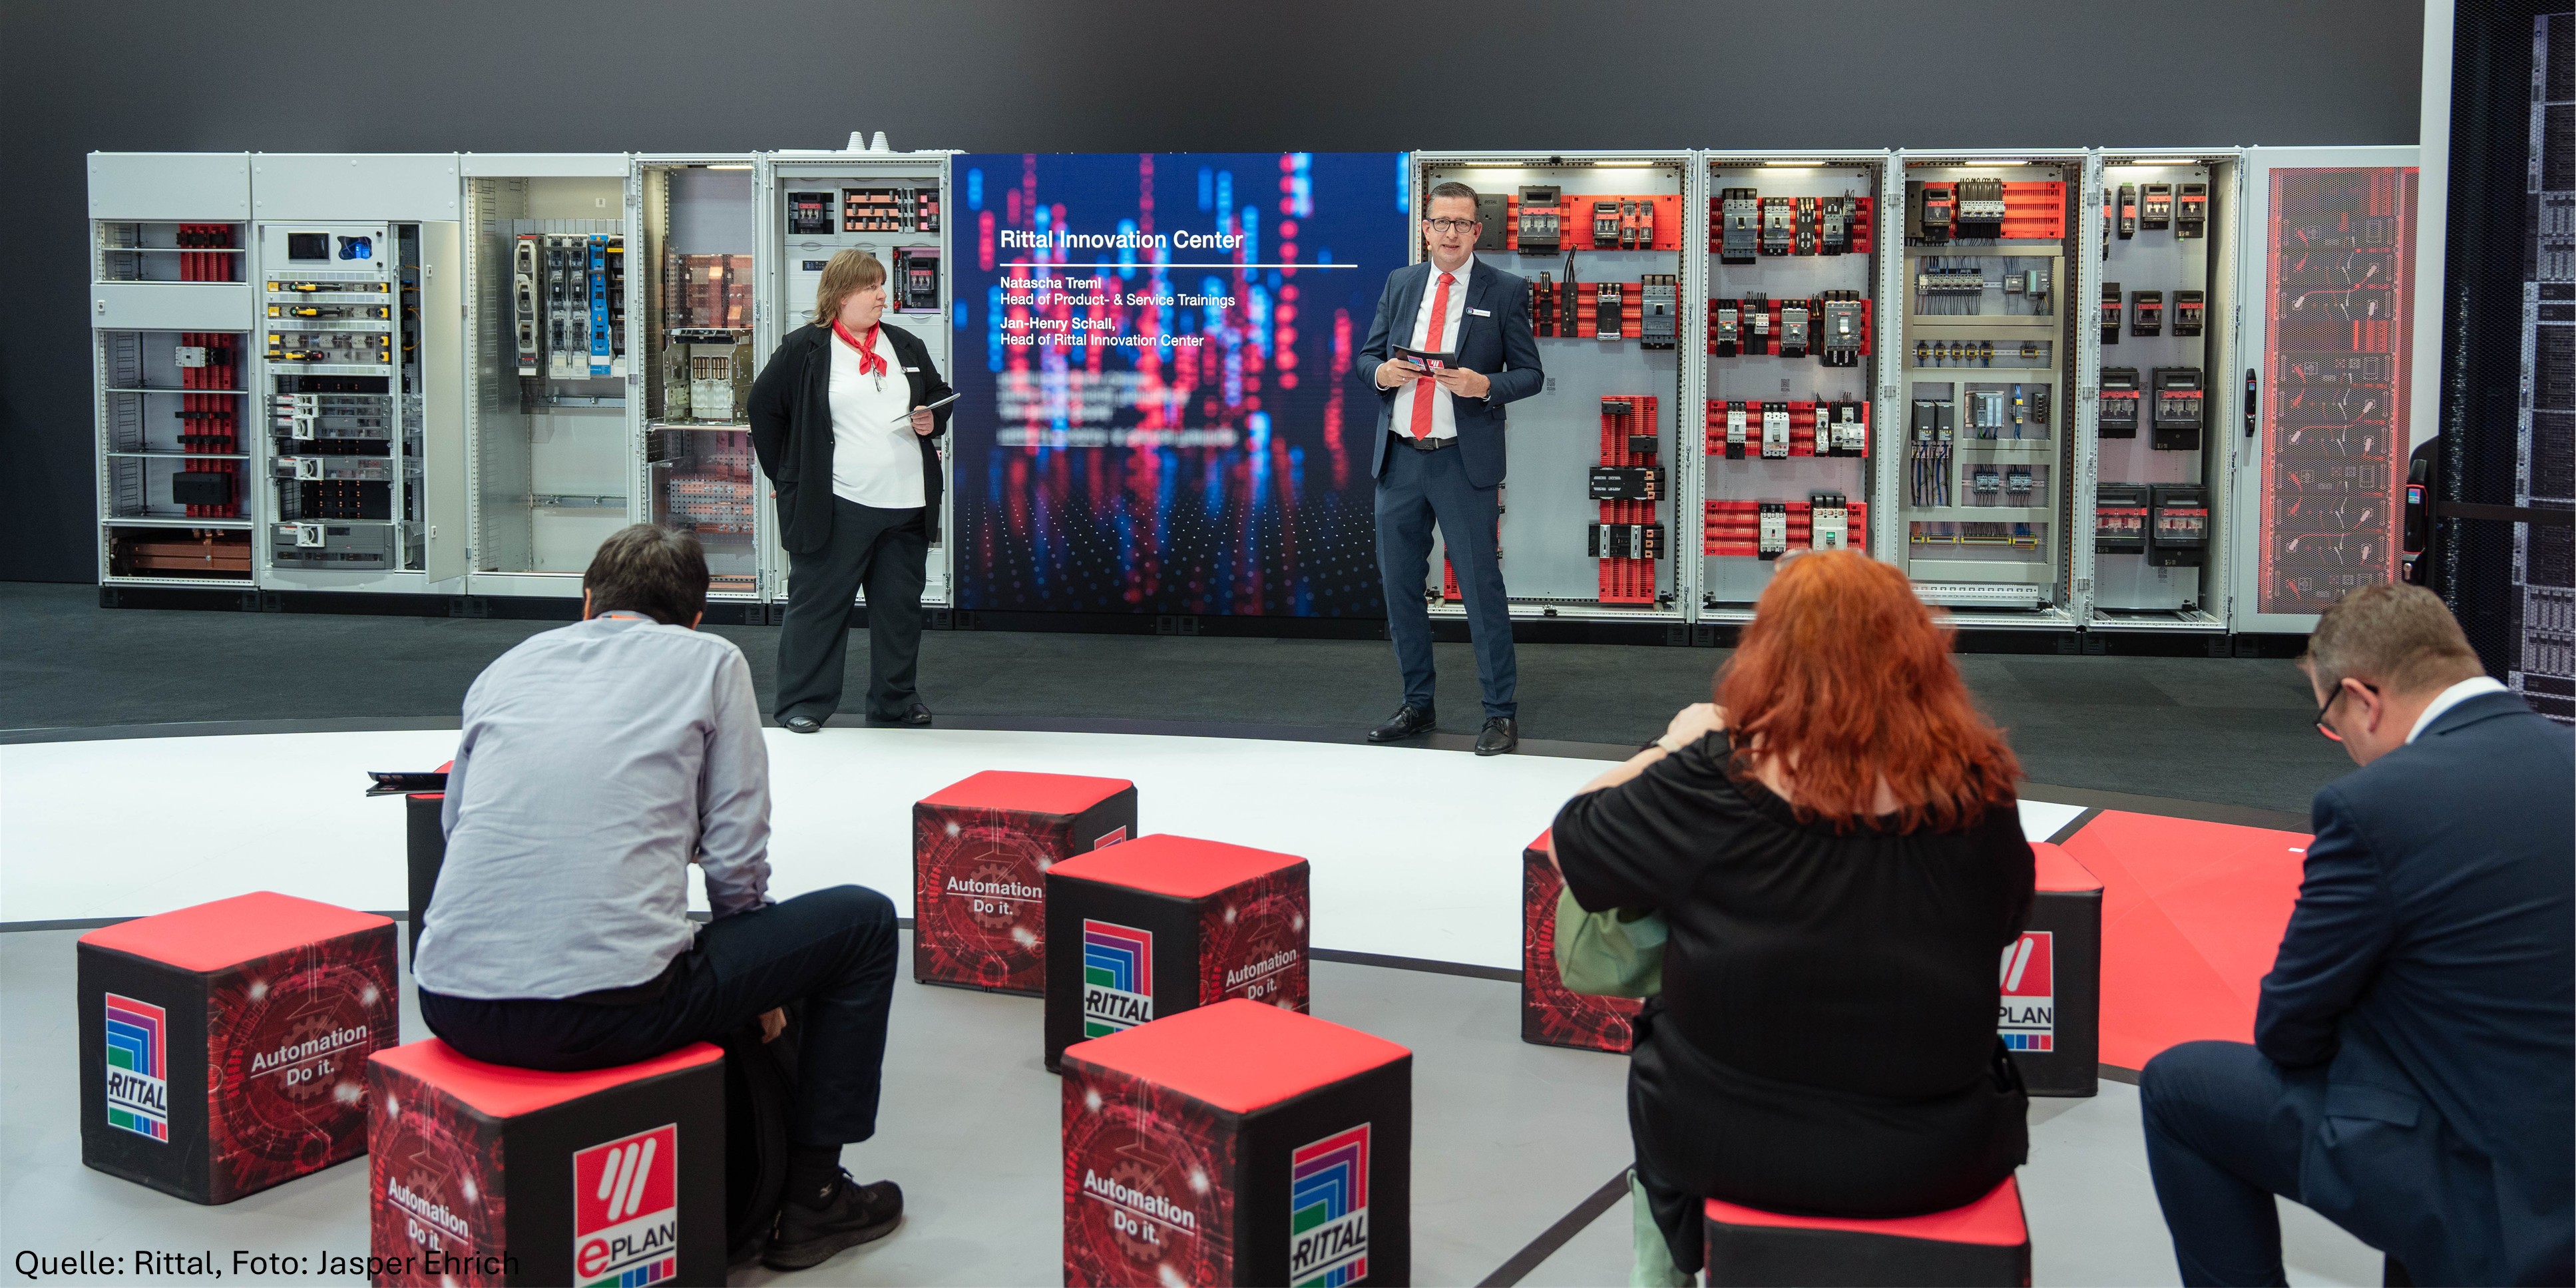
Statement
“We had previously worked with other technologies and providers, and Hannover Messe was the first time we chose knw. We were truly impressed by the professionalism—from project planning and execution to the smooth coordination with all other stakeholders involved. The quality of the results is outstanding and enables us to evaluate our booth based on a solid and reliable data foundation.
We were able to clearly identify which areas actually perform, how visitors move across our booth, and where we can optimize. What is particularly valuable for us is the ability to compare and develop these insights across different events. For us, it is clear: data-driven analysis will become a central component of our future trade show and exhibition concepts.”
Fabian Stark, Head of Fairs & Exhibitions, Rittal GmbH & Co. KG

D.LIVE / Mitsubishi Electric HALLE: Gaining a Precise Understanding of and Controlling Visitor Counts and the Visitor Experience for the First Time
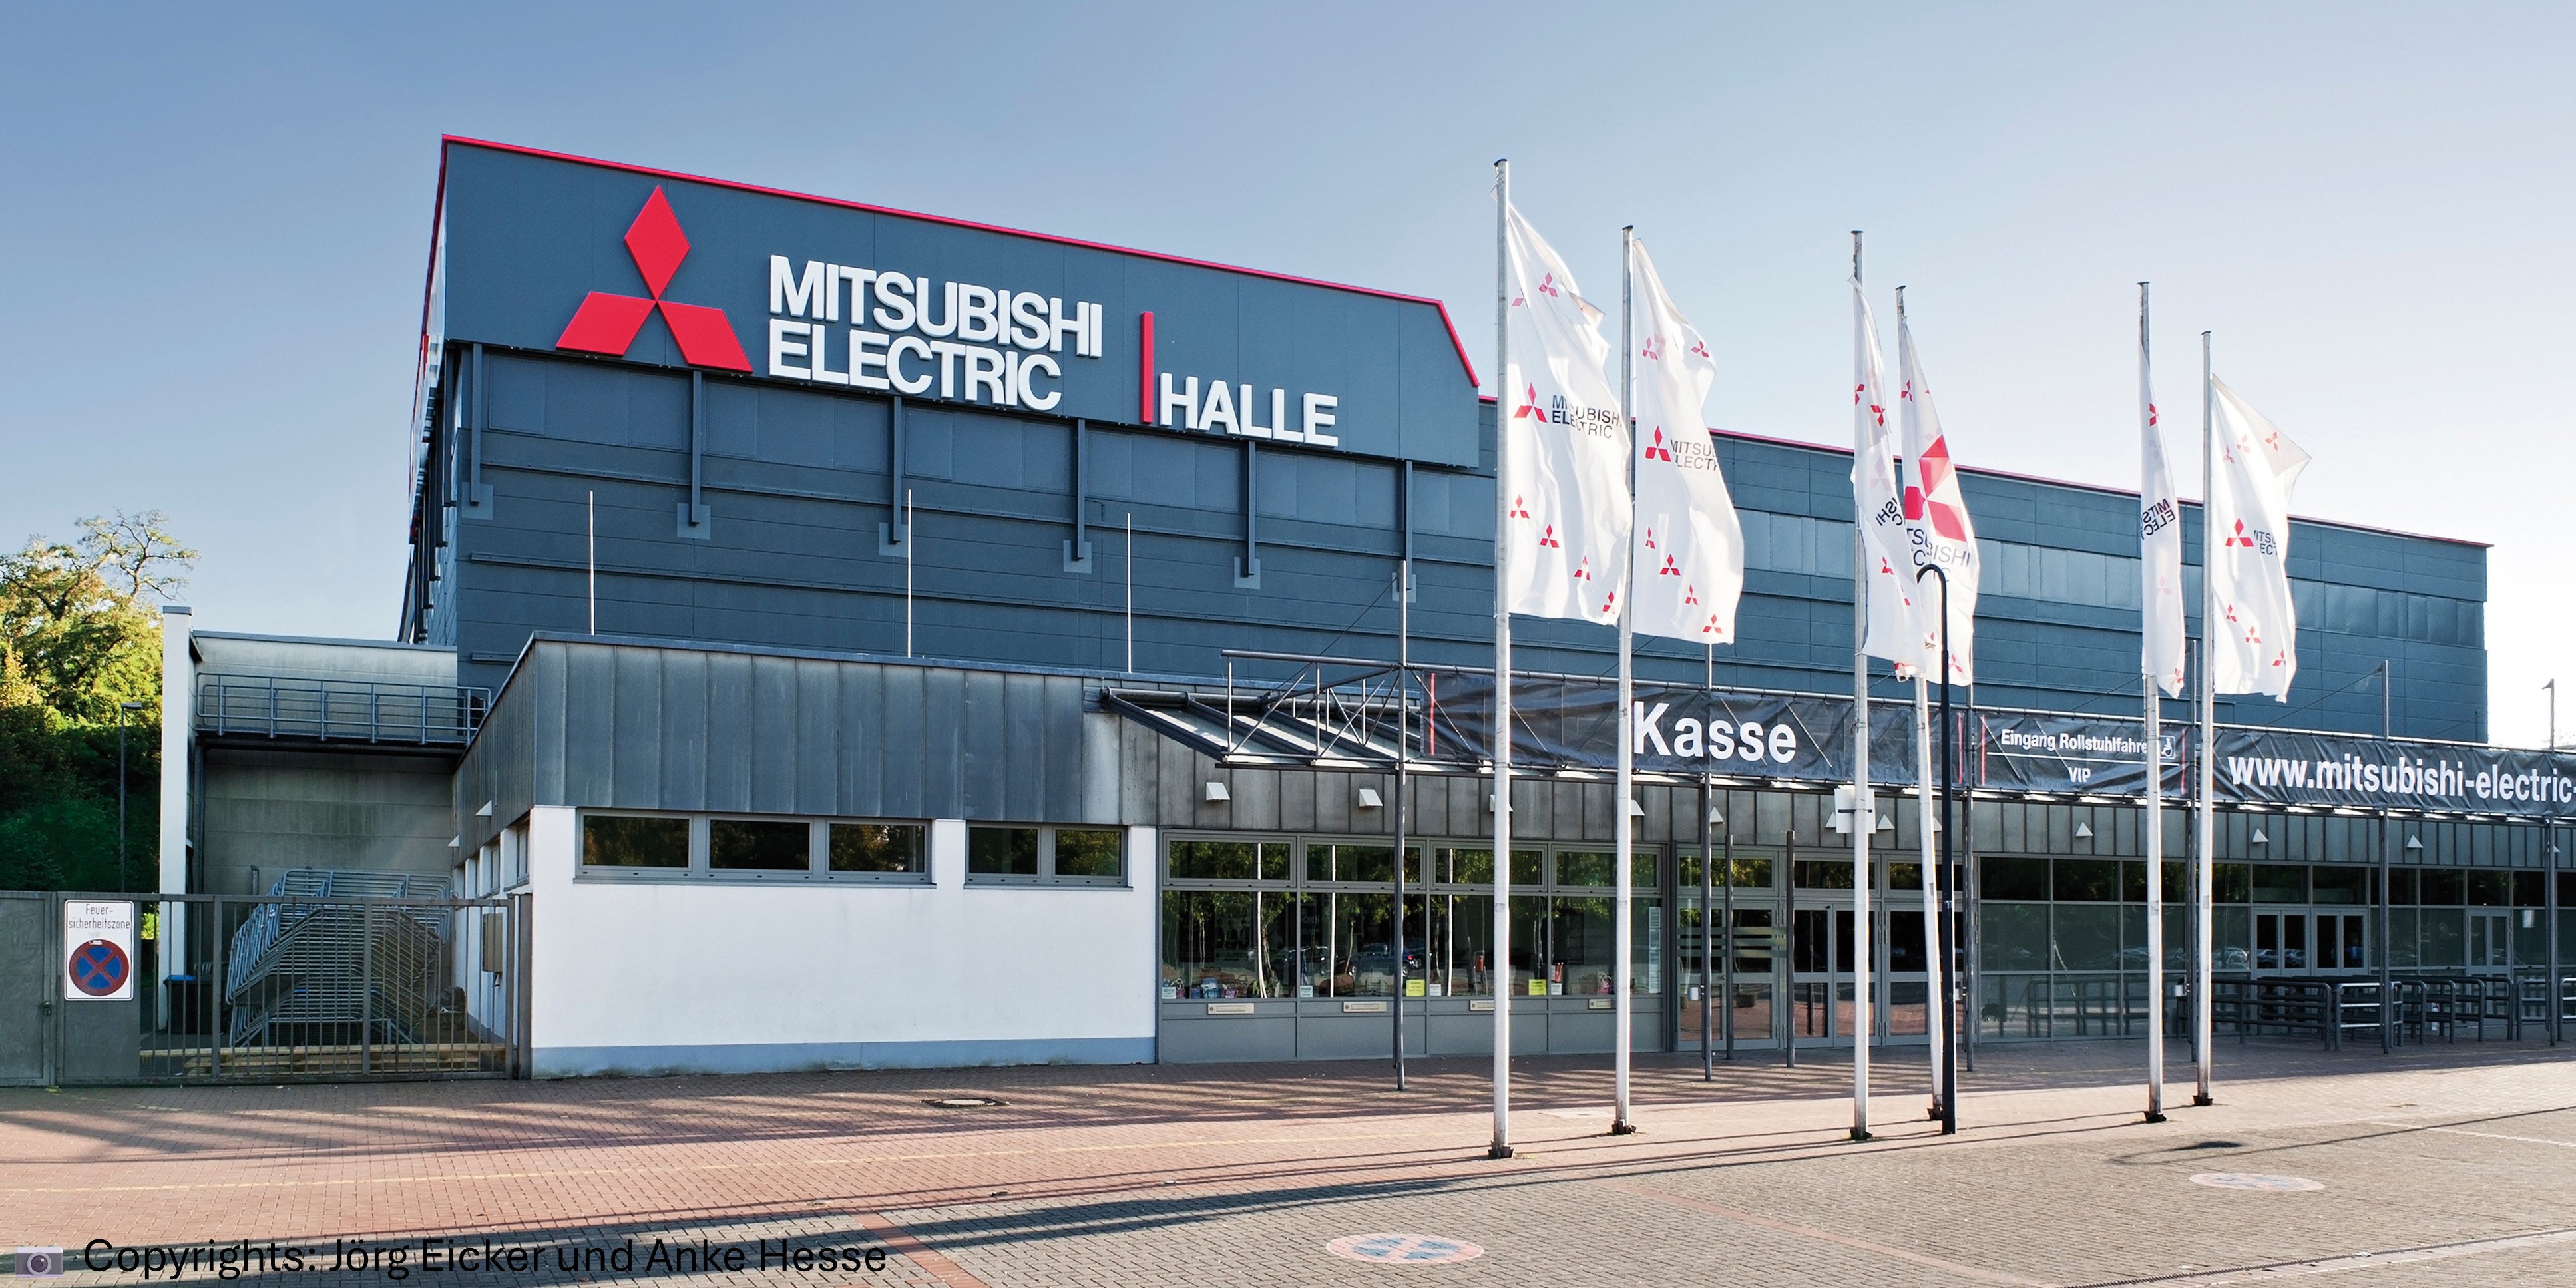
How does an event venue become a data-driven smart venue? | How is D.LIVE creating the foundation for data-driven decision-making at Mitsubishi Electric HALLE?
Mitsubishi Electric HALLE: The Journey to a Data-Driven Venue
Initial Situation
Mitsubishi Electric HALLE is one of Düsseldorf’s premier event venues and part of the D.LIVE venue portfolio. Like many established venues, it faces a common operational challenge:
Visitor flows are visible, but not measurable.
Particularly in key areas such as entrances and foyers, highly dynamic situations arise that are critical for operations, safety, and the overall visitor experience:
▪️ How many visitors actually enter the venue, and at what times?
▪️ How are guests distributed throughout the foyer before and during an event?
▪️ Where do bottlenecks or waiting times occur?
▪️ What relationships exist between waiting times, catering revenue, and staffing levels?
In day-to-day operations, these questions are often answered through experience and isolated observations rather than through reliable data. A systematic, data-driven foundation has been missing.
Technical Implementation
To close this information gap, D.LIVE has decided to equip the entrance area and foyer of Mitsubishi Electric HALLE with a Vision AI solution from knw.
The goal is not simply to measure individual metrics, but to establish an integrated system that provides a comprehensive understanding of visitor behavior.
Visitor Counting at the Entrance
A sensor-based system is being implemented at the venue entrance to accurately measure visitor flows:
▪️ Real-time counting of entries and exits
▪️ Measurement of flow rates and peak periods
▪️ Analytics enabling reliable occupancy assessments
Particular attention is being paid to the optimal positioning of sensors to ensure valid detection of movement directions and visitor flows.
Analysis of Dwell Time and Movement Patterns in the Foyer
The foyer serves as the central hub of visitor activity and therefore represents the starting point for customer journey analysis. The initial focus includes:
▪️ Measuring dwell times and movement patterns
▪️ Occupancy analysis of defined areas and points of interest
▪️ Identification of highly frequented areas and route patterns
▪️ Analysis of waiting times, catering performance, and staffing deployment
Due to the venue’s spatial characteristics, a combination of sensors and cameras is being used to achieve the highest possible data quality.
For specific use cases - such as demographic analysis or crowd monitoring - top-down sensors will be deployed, providing highly accurate results even during periods of high occupancy.
Systematic Zone Definition
A key element of the setup is the structured segmentation of the venue:
▪️ Definition of entrance and transition zones
▪️ Linking entrance areas with foyer analytics
▪️ Creation of a continuous picture of visitor movements
In addition, existing systems such as cameras and other available data sources are being evaluated for integration to create a more complete understanding of visitor flows and movement patterns.
The solution can also incorporate third-party data sources, including weather and traffic information.
Technology Optimization During Live Operations
The project also serves as a reference case for the optimal combination of different technologies:
▪️ Integration of camera- and sensor-based solutions
▪️ Adaptation to venue-specific conditions such as ceiling heights, sightlines, and visitor density
▪️ Continuous validation of data quality during live operations
The project will generate tangible, immediately actionable benefits for venue operations:
Enhanced Safety Through Transparency
For the first time, it will become visible how visitor flows actually behave during critical situations.
This enables:
▪️ early identification of potential bottlenecks and anomalies
▪️ evidence-based assessment of risk situations
▪️ data-driven decision-making for safety and security concepts
More Efficient Operational Management
The analysis of the visitor journey provides a precise understanding of space utilization and the optimal deployment of staff.
▪️ When do peak demand periods occur?
▪️ Which areas are most heavily frequented, and when?
▪️ How do visitor flows change over time?
These insights support targeted planning of:
▪️ staffing
▪️ wayfinding and circulation management
▪️ entry management and visitor routing
▪️ capacity management
▪️ coordination with authorities and partners
Technological Advancement
The parallel deployment and comparison of different technologies will generate additional insights that can serve as a foundation for future planning.
▪️ Which systems deliver the highest quality under real-world conditions?
▪️ How can installation effort be minimized?
▪️ Which solution is scalable over the long term?
Conclusion
With this implementation, Mitsubishi Electric HALLE is evolving from a traditional event venue into a smart, data-driven venue.
The combination of precise visitor counting at the entrance and detailed foyer analytics creates a new level of operational transparency.
Once fully integrated into live operations, D.LIVE will operate one of Europe's most advanced venue-based systems for measuring and analyzing visitor flows.
The result is more than a technological advancement - it establishes a new foundation for operational decision-making, safety management, and visitor experience optimization.
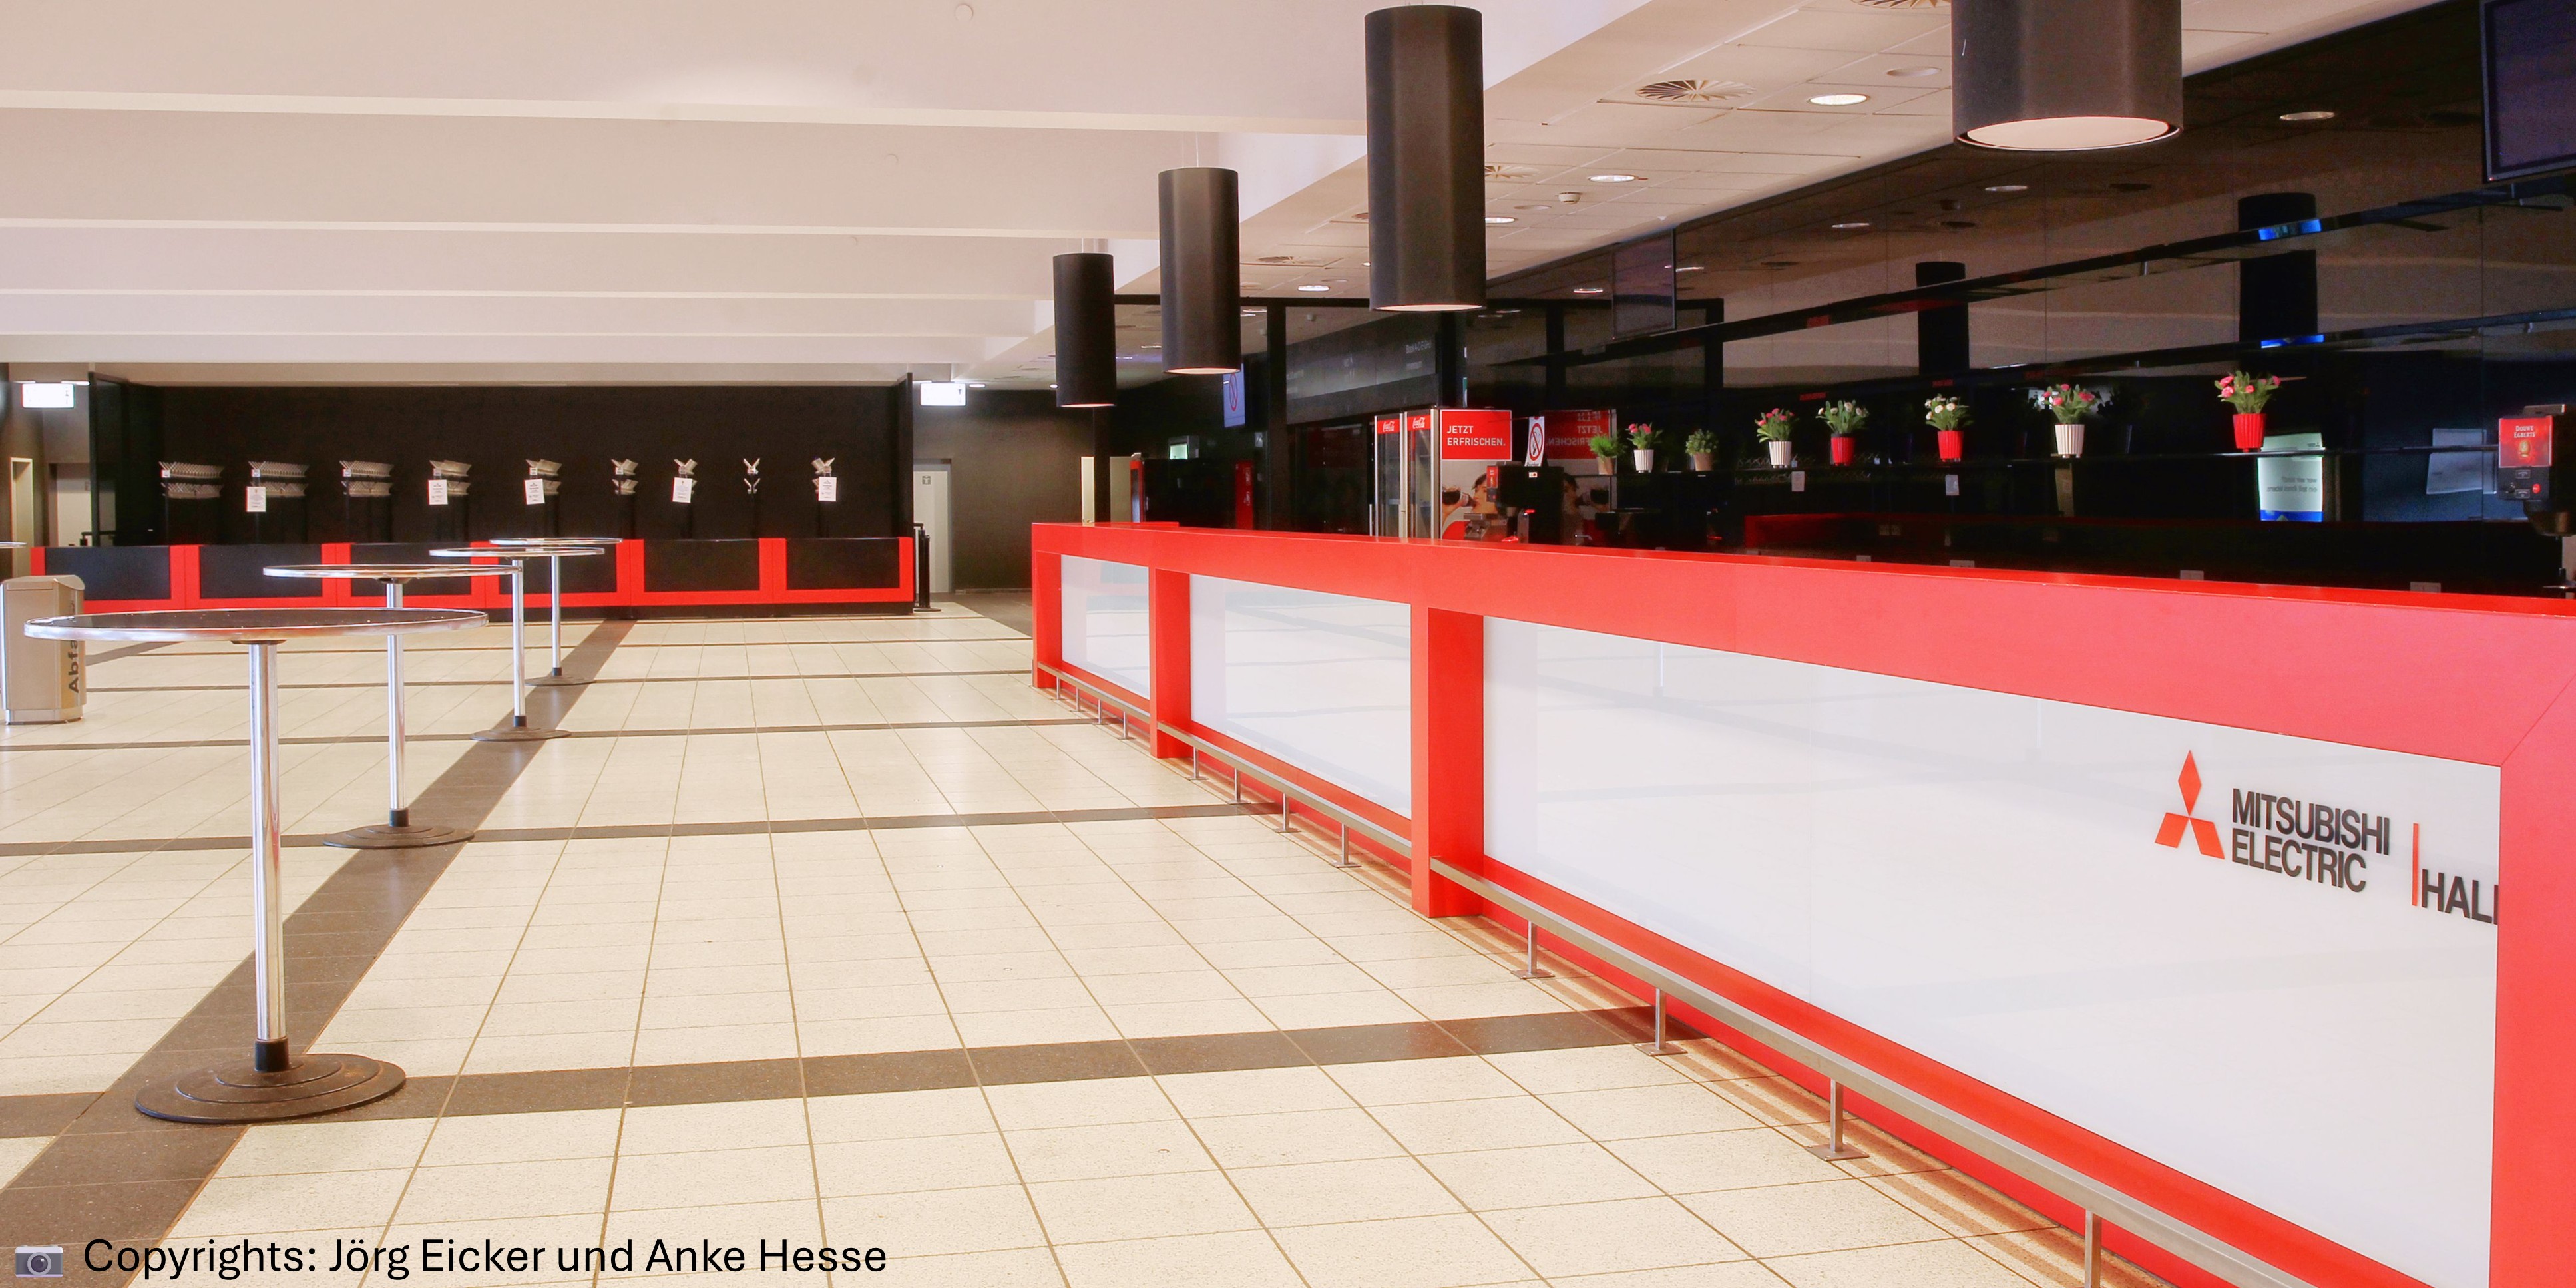
Use Cases
Would you like more details and examples? Download our use cases and make an appointment.