Measure trade show performance. Understand impact. Increase success.
With the Expo Performance Guide from knw., exhibitors can finally see which exhibits truly attract attention, how visitors move across the booth, and where optimization potential lies - all in real time and fully data‑driven.
Why exhibitors are still making decisions in the dark
Trade shows require significant budgets, complex planning, and high expectations. Yet one essential question often remains unanswered: “What actually worked?”
Across nearly all industrial and technology trade shows, three fundamental challenges persist:
Without objective data, exhibitors don’t know: Which paths visitors take, where bottlenecks form and which areas are nearly invisible to attendees.
Manufacturers and automation companies often transport multi‑ton machines to leading trade shows. For Hidden Champions especially, exhibit ROI is a key decision‑making factor.
Quantity isn’t quality. Without data, exhibitors cannot distinguish between: “just walked by” vs. “real interest + meaningful dwell time.” This lack of transparency leads to poor decisions in exhibit selection, booth layout, and performance reporting to management and sales.
The knw. approach - making expo performance measurable
We combine Customer Journey Analysis and Sentiment Analysis to deliver a clear, objective view of your booth -without adding complexity for your team.
Customer Journey Analysis
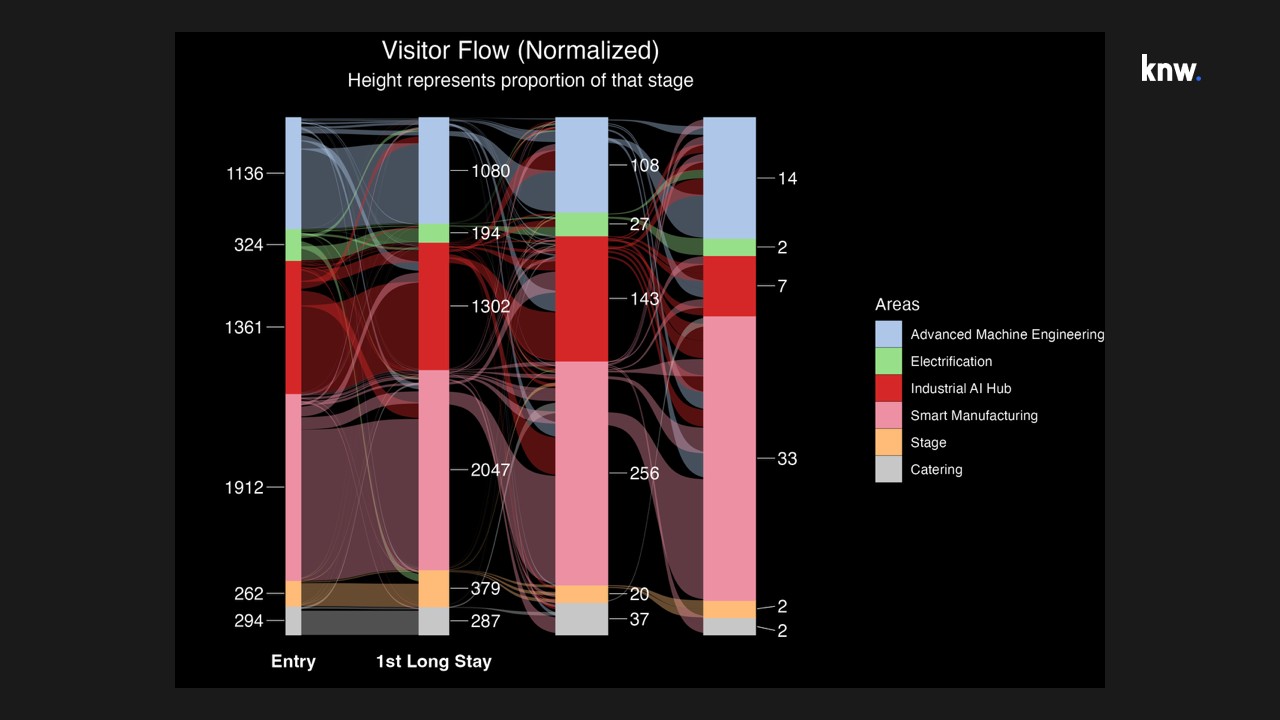
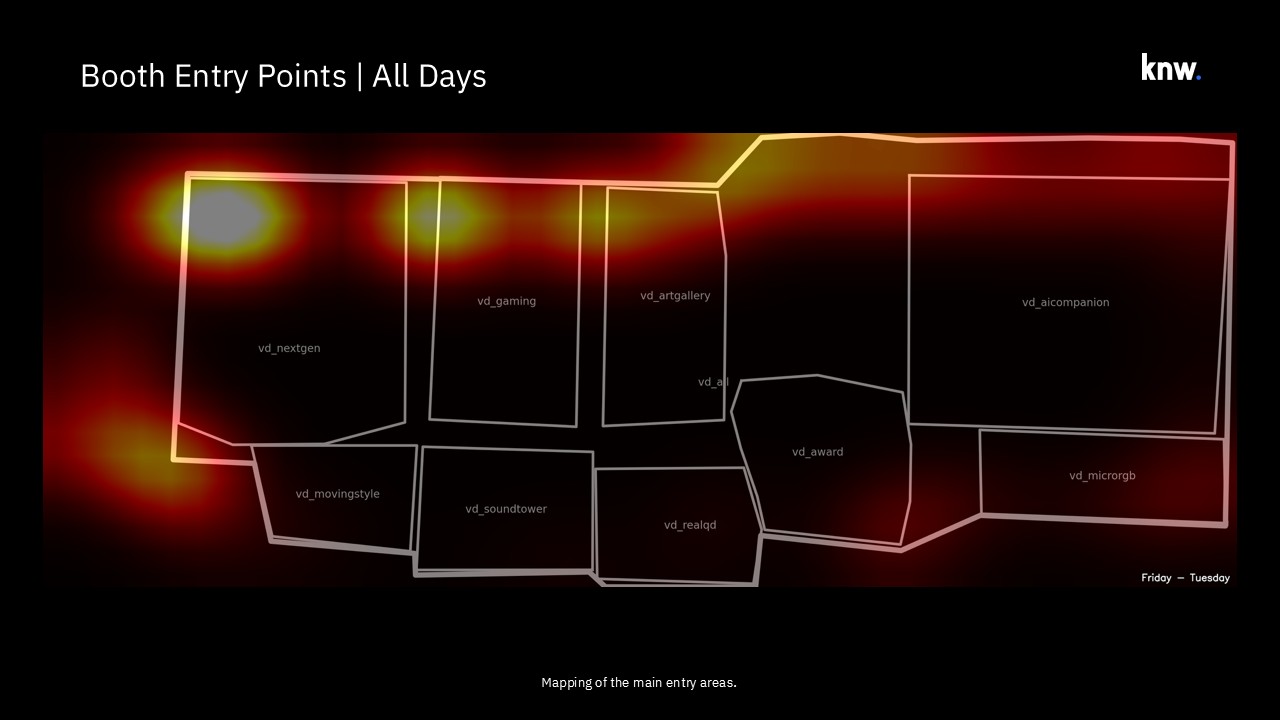
Identifies in real time: pathways, hotspots, dwell times, and zone attractiveness - ideal for optimizing booth layouts, exhibits, and staffing.
Learn more about (Flow Management)
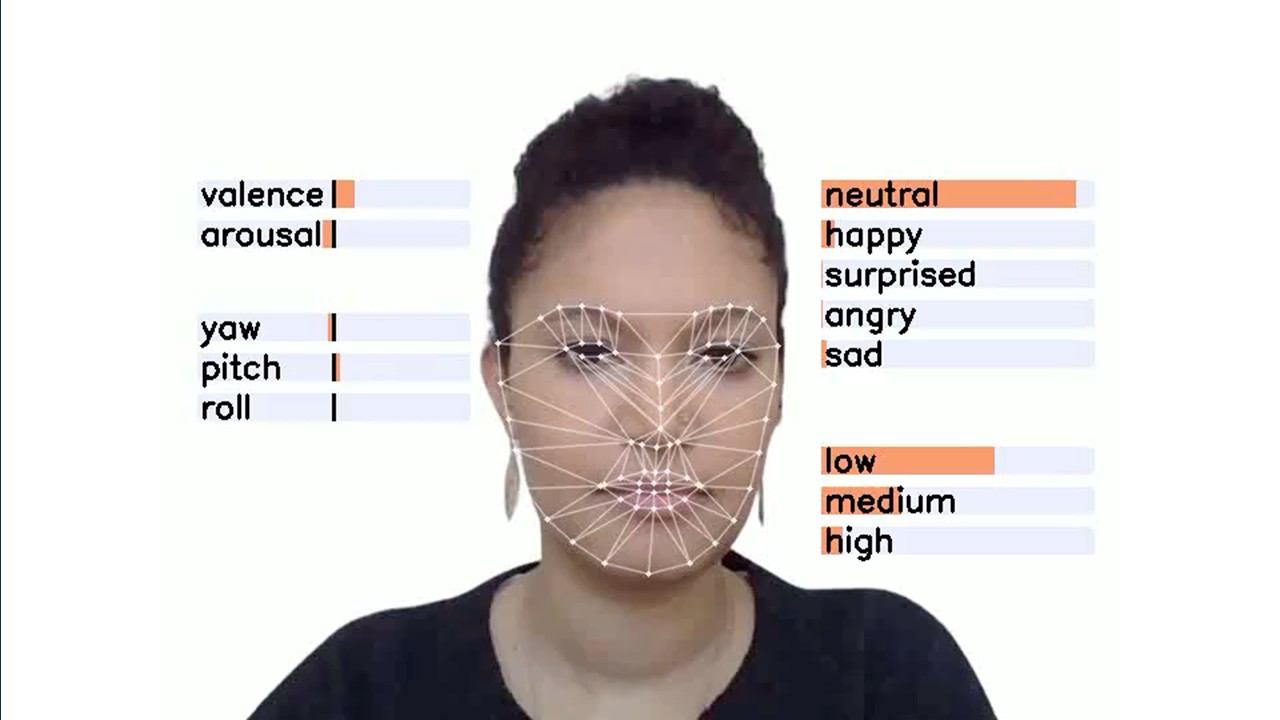
Sentiment Analysis
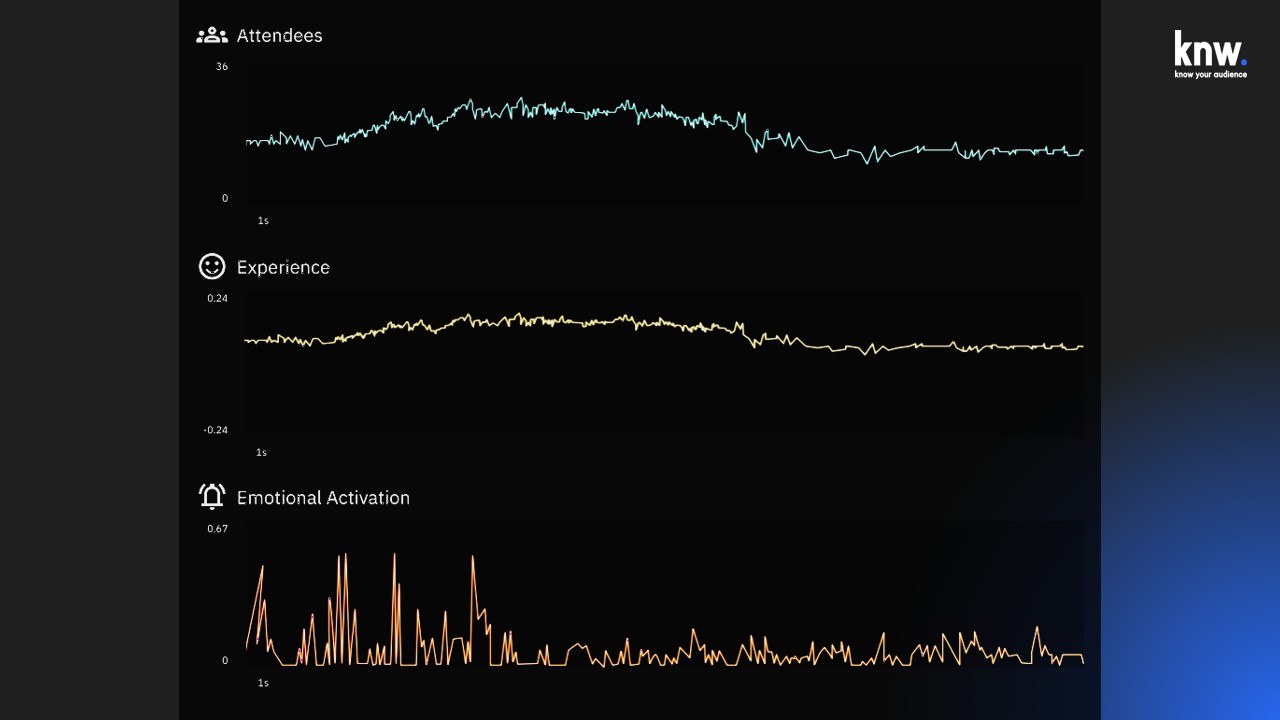
Our AI analyzes emotional reactions to exhibits: curiosity, interest, excitement - ideal for complex industrial goods and technical products.
Learn more about Sentiment Analysis
Visitor Quality Score
The most important KPI for exhibitors: How valuable is each visitor interaction?
See more under (Sentiment Analyse)
The three most important use cases for exhibitors
Use Case 1: Measuring exhibit ROI
Which exhibits truly attract interest?
How many visitors actually stop?
Which areas underperform expectations?
Why it matters:
Companies in machinery, automation, and intralogistics rely on extremely costly exhibits.
Imagine a machinery manufacturer - for example, SIEMENS or CLAAS - showcasing multiple heavy, multi‑ton exhibits at Hannover Messe or Agritechnica. These machines cost millions to produce and generate substantial transport, setup, and booth space expenses.
knw.’s expo performance analysis pinpoints the biggest “no‑brainer” opportunity: Companies invest massively in exhibits without knowing whether visitors even notice them.
This use case answers - for the first time with real data - which exhibit truly creates impact, instead of relying on guesswork.
Use Case 2: Optimizing staffing and booth operations
Flow Management automatically identifies:
When visitor traffic peaks
Where booth teams are understaffed
When experts should be present at key exhibits
Why it matters:
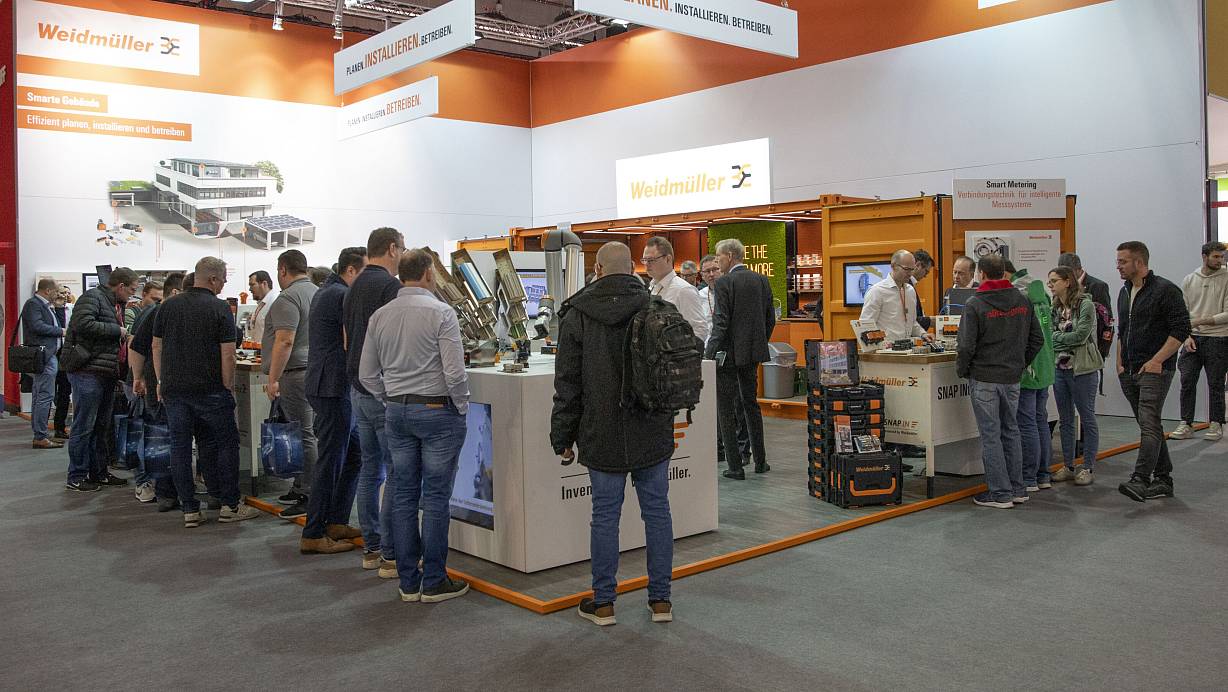
Many companies operate large, multilevel booths at leading trade shows.
Take a company like Weidmüller or Rittal at SPS or Hannover Messe: during peak hours, visitors may gather in multiple rows around one exhibit, while other booth areas remain unused. The core issue: Staffing is often planned statically, while visitor flows at trade shows are highly dynamic.
This use case shows how real‑time data reveals: where interest surges, when waiting times emerge, and where expert staffing has the highest impact.
The result: better resource allocation and significantly higher conversation quality.
Use Case 3: Understanding visitor quality, not just quantity
Not every visitor is a potential customer. The data reveals:
Which visitors interact deeply
Where “deep‑dive” moments occur
Which content drives genuine interest
Why it matters:
For niche B2B target groups - such as machinery or industrial equipment buyers - quality matters far more than traffic volume.
Companies like SAMSUNG or Krones showcase broad portfolios, from small sensors to complex automation systems. High booth traffic is common, but - as knw.’s analysis shows - “a lot of traffic” does not equal “high interest.”
This use case distinguishes casual visitors from those who demonstrate meaningful, high‑value engagement.
For B2B exhibitors with specialized target groups, this insight is crucial to identify true lead potential and allocate marketing and sales resources effectively.
Expo insights & benchmarks
Across industries, our analyses consistently show: 30–60% of booth space is not actively used. Visitors avoid certain areas due to bottlenecks. “Hero exhibits” attract traffic, but smaller exhibits often create higher dwell time. Day‑to‑day optimizations significantly improve performance.
Schedule a consultationFor Hidden Champions
Perfect for companies in machinery, automation, electrical engineering, and logistics solutions. Measure real interactions with your complex, engineering‑heavy products.
For global players
Ideal for large, multi‑zone booths. Optimize complex booth architectures across multiple show days.
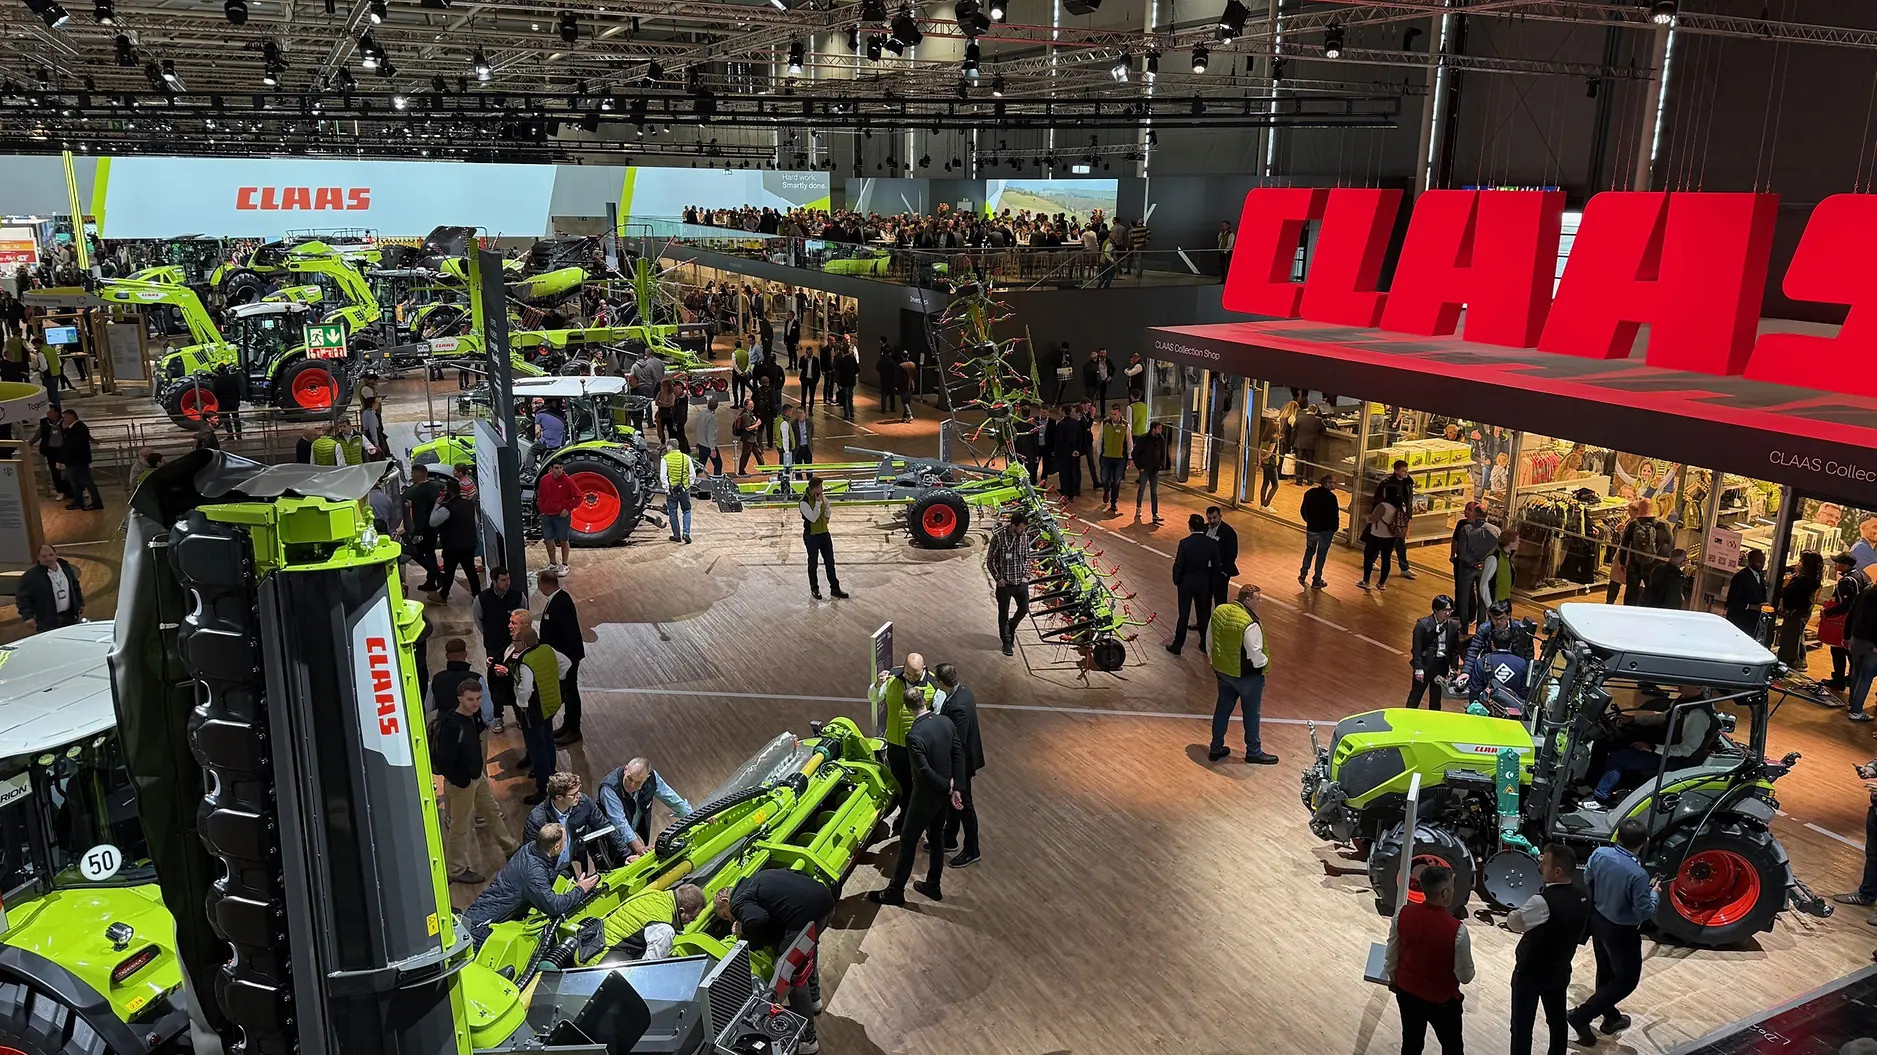
At Agritechnica 2025, knw. enabled us to track which areas visitors entered the booth and where they actually lingered after entering the booth. This gives us a better understanding of hotspots and peak times, allowing us to optimize routing and staffing of the consultation areas in a targeted manner.
David Schiefer, Manager Fairs & Events / Group Marketing, CLAAS Global Sales GmbH
A typical trade show day with knw.
Success with knw. begins before the doors open. During the initial briefing, we jointly define core KPIs - from exhibit ROI to staffing efficiency and visitor quality - and identify the most relevant booth zones and exhibits.
After installation, knw. analyzes visitor flows, hotspots, and emotional responses in real time, revealing which areas perform well and where optimization potential lies.
At the end of each show day, the performance report provides clear insights, which are transformed into immediate actions during the rebriefing: improved booth navigation, targeted staffing, and stronger emphasis on high‑performing exhibits.
Across multiple show days, this creates a continuous improvement loop.
Finally, the comprehensive closing report consolidates all results and provides the first complete, data‑driven view of your booth’s true performance.
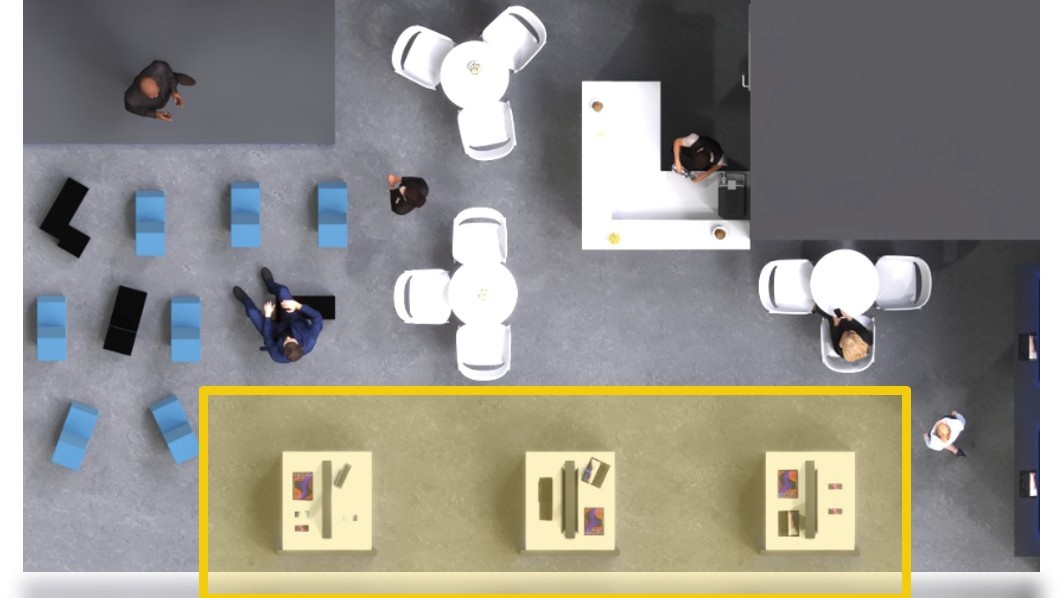
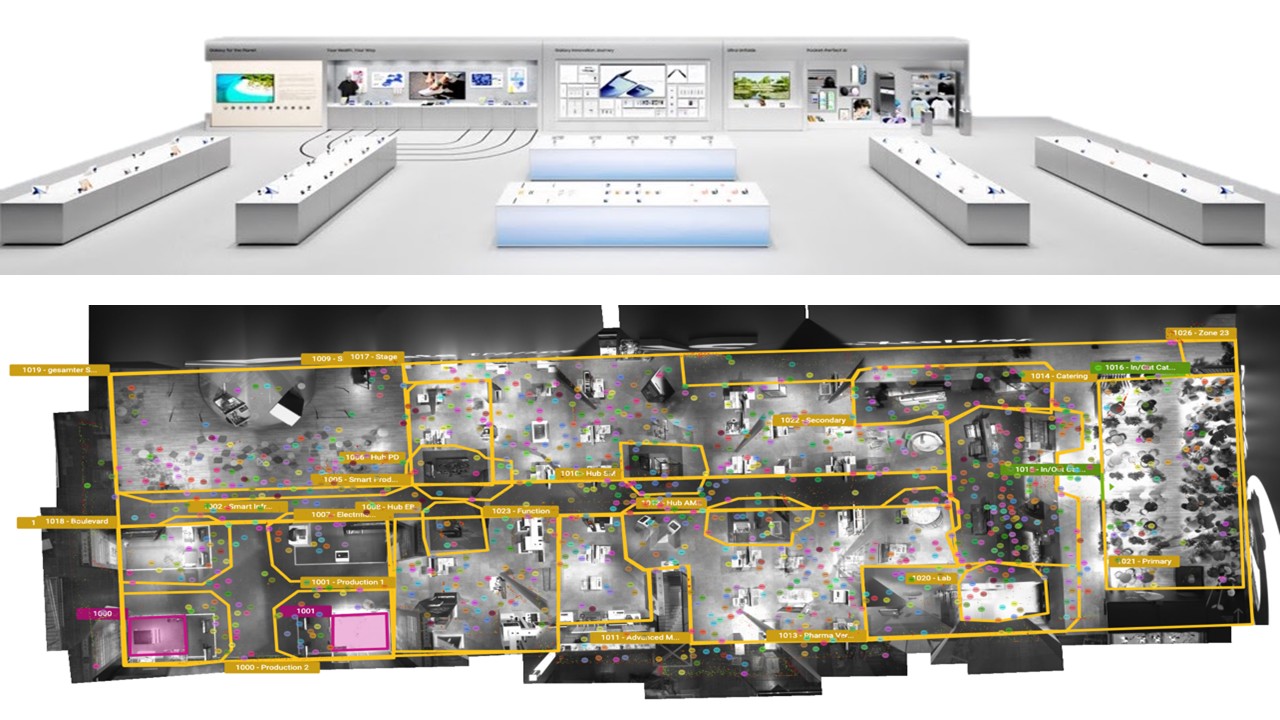
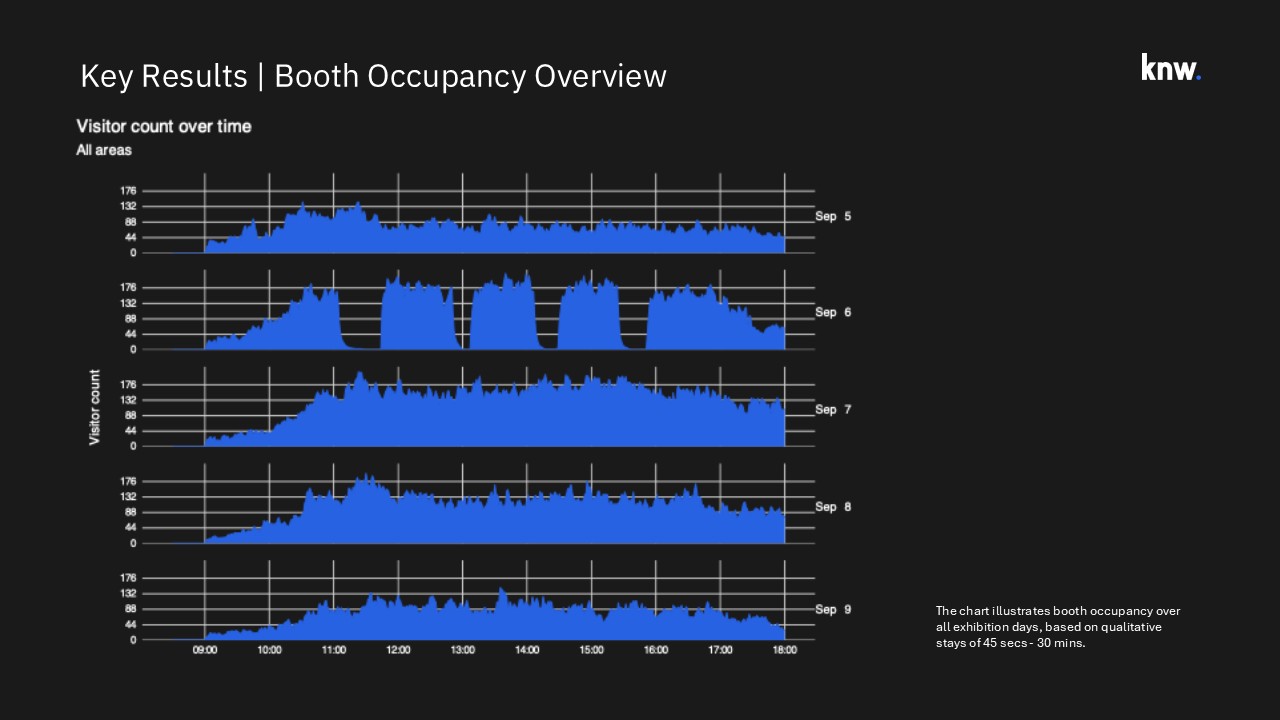
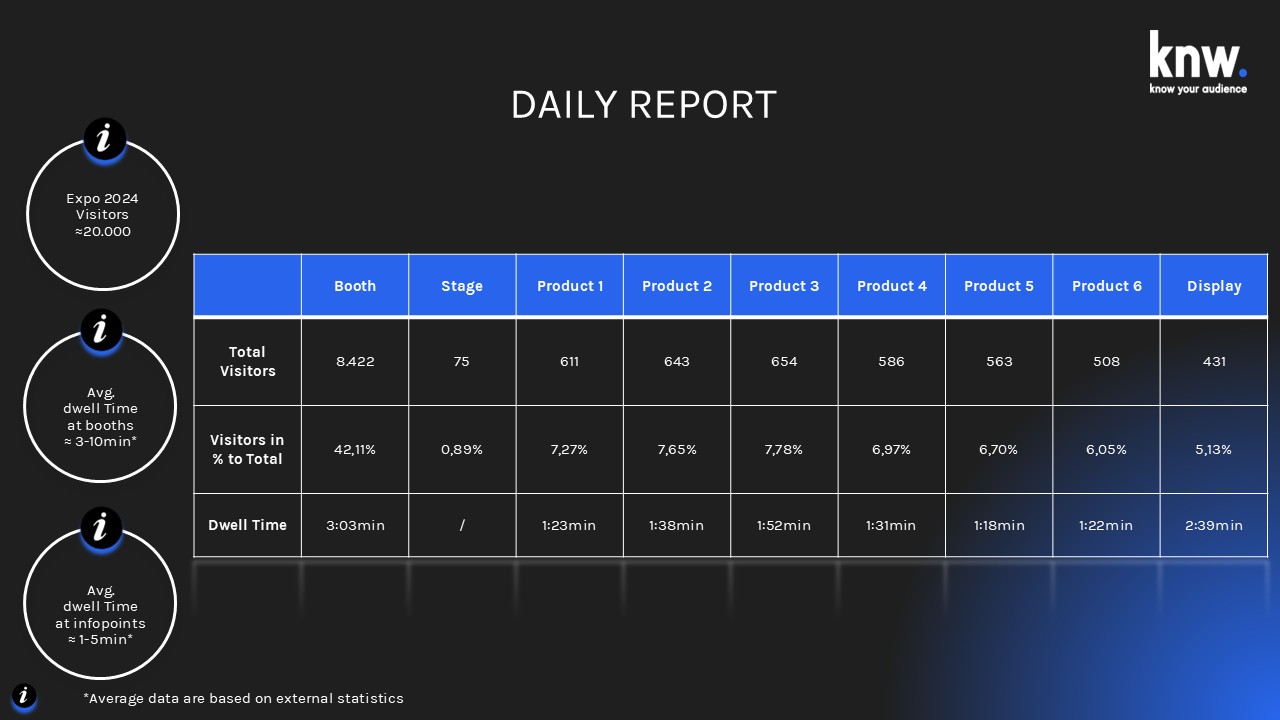
Example reports & visuals
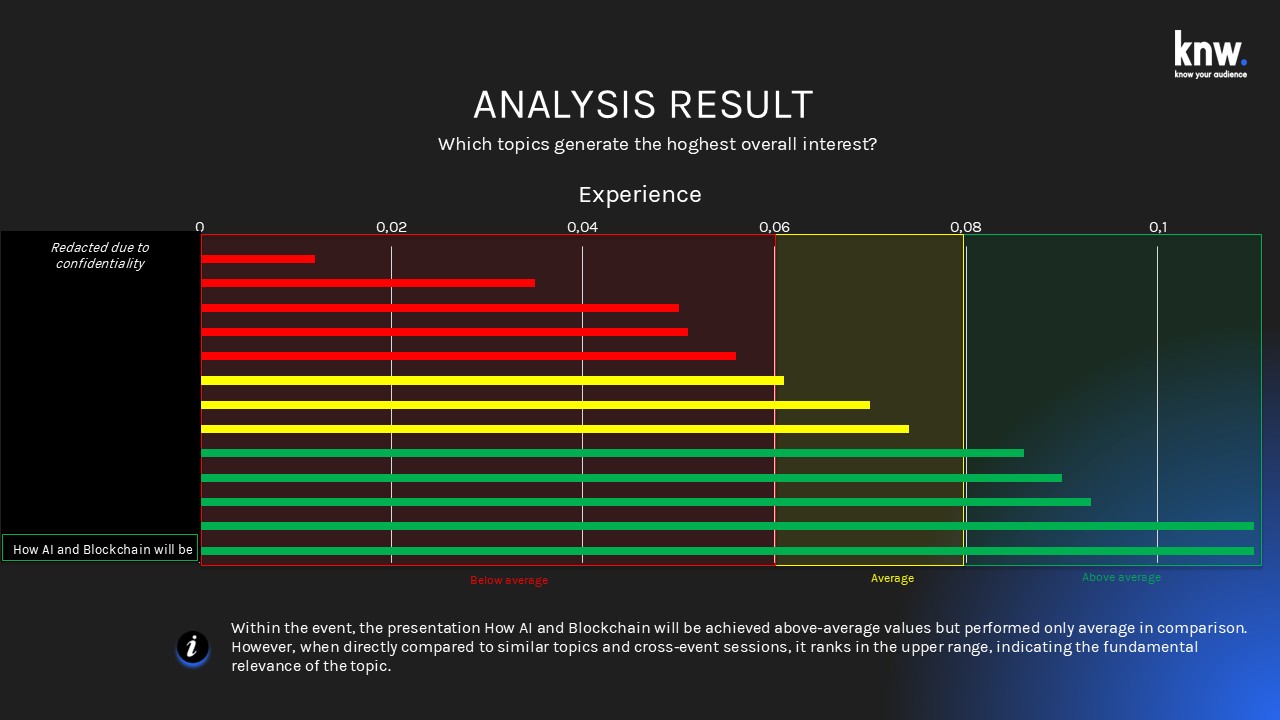
To make the value of our analysis tangible, we provide example reports showing how clearly visitor flows, interactions, and emotional responses can be visualized - from heatmaps to dwell‑time charts, visitor‑flow diagrams, emotional response patterns, and benchmark comparisons.
Example packages & entry options
To help you get started quickly and effectively, we offer structured packages - from an easy pilot to a full premium setup - ensuring a smooth entry into data‑driven expo performance.
Pilot Package (Example)
Perfect for getting started: 1 trade show day, up to 100 m² booth, including mini‑report.
€ 4,000 plus VAT
Standard Package (Example)
For medium‑sized booths: complete Flow Management, Sentiment Analysis, and daily optimization report.
€ 12,500 plus VAT
Premium Package (Example)
For complex multi‑zone booths: full analysis including visitor quality, conversion potential, and an executive summary for management and sales.
€ 30,000 plus VAT
Customer Journey Analysis & Sentiment Analysis
Start your next trade show with data - powered by knw.
Schedule a demo
FAQ - Frequently Asked Questions
Is knw. compliant with data protection regulations?
Yes, fully compliant and privacy‑first.
How quickly can we get started?
Within just a few days, even immediately before a trade show.
Do we need our own hardware?
No, we provide everything you need.
Is knw. also useful for smaller booths?
Absolutely, even small booths gain meaningful insights.
AI Vision & Real‑Time Analytics in action at leading trade shows
Our solutions leverage state‑of‑the‑art AI Vision and real‑time analytics to accurately measure visitor flows, interactions, and attention - fully compliant and privacy‑safe.
Industrial and technology companies rely on knw. at leading global shows, including Hannover Messe, SPS, Light & Building, Electronica, Interpack, ISE, and many more.